
Warren Buffett also explained his preference for stocks as follows:
Today the world's gold stock is about 170,000 metric tons. If all of this gold were melded together, it would form a cube of about 68 feet per side. (Picture it fitting comfortably within a baseball infield.) At $1,750 per ounce -- gold's price as I write this -- its value would be about $9.6 trillion. Call this cube pile A.
Let's now create a pile B costing an equal amount. For that, we could buy all U.S. cropland (400 million acres with output of about $200 billion annually), plus 16 Exxon Mobils (the world's most profitable company, one earning more than $40 billion annually). After these purchases, we would have about $1 trillion left over for walking-around money (no sense feeling strapped after this buying binge). Can you imagine an investor with $9.6 trillion selecting pile A over pile B?
A century from now the 400 million acres of farmland will have produced staggering amounts of corn, wheat, cotton, and other crops -- and will continue to produce that valuable bounty, whatever the currency may be. Exxon Mobil will probably have delivered trillions of dollars in dividends to its owners and will also hold assets worth many more trillions (and, remember, you get 16 Exxons). The 170,000 tons of gold will be unchanged in size and still incapable of producing anything. You can fondle the cube, but it will not respond.Considering peak oil is around the corner, Exxon Mobil may not be the best example ever, as it might be worth zero in 100 years, along with lots of other stocks 9if not all stocks). But let's go back to the subject of the S&P 500 outperforming Gold since 1965. I have edited an excel spreadsheet to calculate the return of the S&P 500 including dividends since 1965 (but excluding fees and taxes) as well the same return with Gold (again excluding premiums and taxes) and drawn the chart shown below (Click to enlarge).
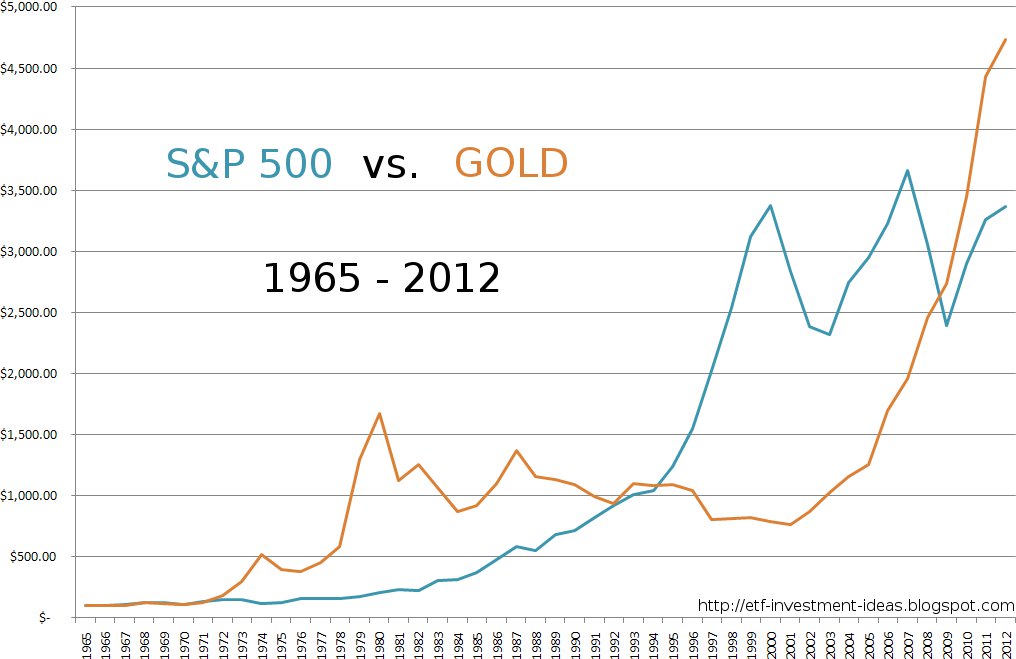
- Gold and Stocks appear to work in cycles, with period where stocks massively outperform Gold and vice versa. A logarithmic chart would show Gold is just at the onset of this cycle and should go much higher vs. stocks in the S&P 500. So there is no "Gold is better than Stocks' or "Stocks are better than Gold", there are just wealth cycles.
- If I find the same result as Fortune for Gold appreciation since 1965, I just find 100 US dollars invested in the S&P 500 in 1965 would have returned 3370 USD whereas Fortune found those 100 USD would have turn into 6072 USD. I also reinvested dividend (at the end of the year) in stocks for each year.
For the formulas, you can check the S&P 500 vs Gold - 1965 - 2000 Spreadsheet.
So if I'm correct, Gold clearly outperformed the S&P 500 (including dividends) during that period. To be fair, if they had chosen 1950 has the starting we may have a different story.
No comments:
Post a Comment