Tuesday, January 31, 2012

Marc Faber February 2012 Market Commentary

Marc Faber has just released his February 2012 market commentary on the gloomboomdoom.com website.

This month report is entitled "In all Investments it is a healthy Thing Now and Then to Hang a Question Mark on the Ideas we Have long Taken for Granted", implying that we should always reconsider the things we think of as obvious truth.

There is 1 attachment with this monthly market commentary (MMC) :
  • "2012: A Year of Reflation and Bursting of the "Bond Bubble"" by Michael A. Gayed,Chief Investment Strategist at Pension Partners, LLC
Michael A. Gayed regularly posts articles on Seeking Alpha, I would not find recent articles related to the Bond Bubble, but he has some articles about the Reflation and the relation between treasuries and the US dollar in his "Winter Resolution of 2012" articles.

If I can find a summary, I'll post highlights of the Gloom Boom Doom market commentary a bit later.

Jim Rogers: Politicians Want To Fool Us This Year

Jim Rogers is interviewed by CNBC on the 30th of January 2012.

They firstly talk about bank bonuses, then about prospects for US and Europe in 2012. Jim Rogers is not worried about the Euro this year, because of the elections around the world, which will lead to more printing by the central banks and more spending by politicians.


Saturday, January 28, 2012

US Markets Valuation, Sentiment and Technical Analysis - January 2012

In recent weeks, the S&P 500 has performed very well, almost reaching 2011 highs. At the same time, several indicators would seem to indicate a recession is coming to the US in 2012 and the Baltic dry Index does not look good either.

Today, I'm going to look at US markets, both in terms of valuation and sentiment. I will also look into technical factors to help determine whether it is a good time to sell or even short US markets.

S&P 500 Valuation.

For long term investors, Shiller S&P 500 CAPE (10-year price earning ratio adjusted for inflation) is the reference to assess whether the S&P 500 is undervalued or overvalued. Here's what it looks like today:

 The CAPE stands at 21.14, it's much lower than the CAPE in 2000 (That is when Shiller talked about "irrational exuberance"), but still high compared to historical CAPE (average is around 15-16).

Another way, I like to look at valuation is by looking at earnings only. Historically, they've had a tendency to increase at a fix rate over long period of time and always oscillate around the trend line. That's the "mean reversion" preached by Jeremy Grantham. Here's the logarithmic chart of S&P 500 inflation-adjusted earnings between 1870 and 2012.

In 2011, earnings are above average and will revert to the mean at some point. Of course this could be this year or in several years.

Based on the 2 metrics above, it seems that based on valuation it is rather risky to invest in the S&P 500 or at least it's likely to average disappointing returns.

US Market Investors Sentiment.

Previously I liked to follow Market Harmonics Bull/Bear ratio, but it is not a free service anymore since last April. Now, I use the AAII sentiment index instead:
 Week ending 1/25/2012

Bullish 48.4%
up 1.2
Neutral 32.7%
up 3.5
Bearish 18.9%
down 4.7


According the AAII, the long term average are as follows: Bullish: 39%,  Neutral: 31% and  Bearish: 30%.
That shows people are now pretty optimist about the future. As a contrarian, that would be a bearish sign.

However, I like to look at things in a longer term perspective using AAII-14, as explained in my post "Using AAII Sentiment Survey to Time the Market". If the 14-week moving average of the AAII "Bullish" sentiment index is at 30% or below is a long term buy, above 50% it is a long term sell.
Now the AAII-14 is at about 42%, so this is neutral.

S&P 500 Technicals.

I'm now going to look at my 2 favorites technical metrics the RSI-14 and the index showing the percentage of stocks above their 200-day moving average (NYA200R).


I use the 14-day relative strength index moving average for short term moves.


The S&P 500 6-month chart and RSI-14 chart (Source: Yahoo Finance) shows it is now at 76.20. On the 23rd of January the RSI-14 was at 87.57 which was overbought, so a short term correction should be expected.

The NYA200R is really the index which tell me "wait" when other indicators tell me to buy or sell. Here's what it looks like today. (Source: StockCharts.com)

At 65.10%, the NYA200R tells me there is probably more upside potential for the S&P 500. I would become wary of holding stocks if it reached 80% or more for several weeks/month.

Conclusion

As some indicators suggest, there are significant recession risks for 2012. The S&P 500 seems relatively overvalued compared to historical ratios. Short term investors are very bullish and the market is overbought. However, longer term, it appears we have to not reached extreme bullishness (as the AAII-14 implies) and the NYA200R would suggest stocks have still more upside.

Based on this analysis, I would personally not add any position at the moment because of valuation and short-term bullishness and would even consider decreasing exposure to US stocks. I would not short the market however, because not all indicators are extreme and we have mad men (e.g. Ben Bernanke) and women (e.g. Janet Yellen) at the head of the US federal reserve that could unleash QE3 after announcing zero interest rates until 2014 since week.

Thursday, January 26, 2012

Baltic Dry Index Near All Time Low

The Baltic Dry Index (BDIY) now stands at 784 USD, basically at the lowest level it reached in November 2008 as you can see in the 5-year chart below.

This index tracks the price of shipping (by sea) and shows an oversupply of ships vs demand for shipping. I've seen some reports saying that this slump is due to the delivery of ships ordered during the boom in 2006/2007 to meet demand. There is indeed a long leadtime to manufacture large vessels. However, this indicator could still confirm the recession call by Hussmann and ECRI as well as a sharp correction for industrial commodities. I've also seen a 12-year chart that shows we are near all time lows.(Sorry I can't find it back).

Another metric for maritime traffic can be the Guggenheim Shipping ETF (SEA), composed of shipping companies. It has also been dropping sharply since February 2012 (-50% top to bottom), although it has stabilized during the last 4 months. The 2-year chart can be seen below.

Both the Baltic dry index and SEA ETF either indicate serious economic troubles ahead, or they have bottomed out and the SEA is a buying opportunity. I know where I stand at the moment...

I previously wrote about BDI in February 2011, as I was worried it would on industrial commodities. In retrospect, it would not have been a bad time to sell stocks and commodities.

Tuesday, January 24, 2012

India to Pay For Iranian Oil with Gold

I've just seen a report on Russia Today saying that following sanctions from the US and Europe on financial transactions with Iran, India and Iran had found a compromise and India would now buy Iranian Oil with Gold.

Would that have any significant effect on the Gold market? Let's see the numbers. Russia Today's reporter said that Indian imported 12 billions USD of Iranian oil per year. Gold is now about 1670 USD per ounce. So That would be around 1.2 millions ounces of Gold or 200 metric tonnes of Gold per year. That's a massive amount considering India had 557.7 tonnes of Gold reserves in 2010 (source: Wikipedia). I assume India will not want to see their reserve go down, so they'd have to buy those 200 tonnes on the Gold market. By the way, 200 tonnes would just be the amount purchased by India from the IMF in 2009 (when gold was around 1100 USD). Another way to look at this numbers is to compare it to the SPDR Gold Trust Holdings - the largest manager of Gold-based ETF - that stood at 1,239 tonnes in May 2011. So if India and Iran actually implement this scheme for one or more years, this would be extremely disruptive on the Gold market both by the amount of required physical Gold and the geopolitical implications of such move.

Saturday, January 21, 2012

Long Term Charts of the Thai Stock Market (SET) - January 2012 Update

This article is the bi-annual update of the long term charts of the SET Index, price earning ratio and price to book value posted on CNX Translation Forum.

Here's our bi-annual update for the long term charts of the Thai stock market.

The chart below is the SET index between 1975 and January 2012, it has fallen sharply after July before rebounding and now stands at 1058.66.

The PER went from 14.5 to 12 in the last six months, due to the correction and earnings improvements. This kind of PER is neutral if we compare it to the PE history of the Thai SET. Six months ago, I expected a correction due to the relatively high PE which occurred and now I'm neither bullish not bearish based on this metric.

The price to book value went down to 1.87 (vs 2.14 in July) which makes Thai stocks slightly more attractive compared to 6 months ago.

To conclude, I believe the Thai stock market is fairly valued at those levels and the average dividend yield is 3.72% (vs 2.92% 6 months ago) which is comparable to what you can get in a fixed deposit (Bangkok Bank now offers up to 3.5 % p.a for a 36 months fixed deposit). I would neither by buyer or seller. However, if your investments are concentrated in US and/or European economies, you may still consider buying Thai stocks as Emerging economies become less reliant on Western economies (although there is no complete decoupling just yet) and Thai banks have virtually no exposure to European debts which make them more resilient should a recession occur in western economies this year.

Friday, January 20, 2012

Marc Faber: Relax! Stocks Won't Collpase

Marc Faber is interviewed by CNN on the 20th of January 2012.

First, they discuss he views that US bonds should be rated Junk, with the debt increasing from 1 trillion dollars in 1990 to 5 trillion dollars in 2000 to now over 15 trillion dollars and if we include unfunded liabilities the number would be much higher (something like 100 trillion dollars).

Now, the debt can be serviced because of low interest rates, but if those would be to increase, it would become much more problematic.

Marc Faber also explained that everybody should relax, equities won't collpase because there isa stron (technical) support at 1100 on the S&P 500, and if the S&P 500 drops 200 points, the federal reserve will start QE3.

Finally, he said that Asian banks (in Thailand and Singapore) are a much safer place than western banks for deposit and that contrary to popular beliefs, emerging economies do no rely so much on the west to sustain themselves.

Tuesday, January 17, 2012

2012 Recession Likely

A recession in the US is likely according to indicators used by John Hussman of Hussmann Funds and the WLI (Weekly Leading Indicator) growth by the ECRI.

John Hussman created a chart (below) corresponding to the average of standardized values (mean zero, unit variance) of the following variables:
  • 6 month change in S&P 500
  • 6 month change in nonfarm payrolls
  • 12 month change in nonfarm payrolls
  • 6 month change in average weekly hours worked
  • ISM Purchasing Managers Index
  • ISM New Orders Index
  • OECD Leading Indicator - total world, 
  • OECD Leading Indicator - US, 
  • ECRI Weekly Leading Index growth
  • Chicago Fed National Activity Index 
  • 3 month average, credit spreads (Baa vs 10-year Treasury), 
  • Industrial commodity prices - 12 month and 6 month change
  • New building permits 6 month change.
Here's the chart between 1952 and 2011.


The level we currently get (-0.5) has always been associated with recessions, except with the false positive in 2003, right after the 2001/2002 recession. It correctly predicted or coincided with 10 recessions, never missed one and gave one incorrect signal as previously mentioned.
The WLIG currently stands at -8.4 (6 Jan 2012), a level usually associated with recession. ECRI insists however they use other leading indicator to make a recession call. That's why they did not make a recession call in 2010, but did make one for 2012.

There is now a fair amount of optimism in AAII survey (~50% bullish), although its' not extreme yet, and lagging indicators give a positive outlook for the US economy, so those recession calls still have many critics, but I believe they will eventually be proven right this year.

GMO 7-Year Asset Class Forecasts - 4Q 2011

GMO has just released its quarterly 7-year Asset Class Forecasts and here are the expected annualized return (based on valuation and historical earning growth):
  • US Large caps: 1.4% per year
  • US Small caps: -0.5% per year
  • US High Quality: 5.3% per year
  • International Large caps: 6.12% per year
  • International Small caps: 5.0% per year
  • Emerging Markets: 6.8% per year
Different kinds of bonds are expected to return between -2.5% and 1.2% per year.
Managed Timber is expected to return 6% per year as always in GMO forecats.
Those are real returns adjusted for inflation of 2.5% per year.

The expected returns have slightly decreased since last quarter, but the best performing assets remain international large caps (Europe & Japan?) and emerging markets and the worst performing assets should be US and international bonds. The US market (except High Quality Stocks) should also be avoided with returns between -0.5% and 1.4% per year.

The ways to act on this forecast remain the same as last time, e.g.  iShares MSCI Japan Index Fund(EWJ), iShares S&P Europe 350 Index Fund (IEV) and iShares MSCI BRIC Index (BKF) on the long side, and buy short ETF for bonds such as ProShares Short 20+ Year Treasuries (TBF). If you can short, you could do so with SPDR Barclays Capital International Treasury Bonds (BWX). However, the expected returns on the short side, may not warrant taking this risk just yet, especially with the decay inherent to short and leveraged ETFs.

You can receive GMO's forecasts (monthly) and the quarterly newsletter for free by registering at http://www.gmo.com

Monday, January 16, 2012

Jim Rogers on Europe Ratings Downgrade

Jim Rogers interview on Russia Today on 16 January 2012 where he discusses the recent S&P downgrade of many European countries and what the future may hold if Europe breaks up.


Sunday, January 15, 2012

GEAB 61: Global Systemic Crisis: 2012 : The Year of the Great Global Geopolitical Swing

Here are the highlights of GEAB 61 (January 2012) entitled "Global Systemic Crisis: 2012 : The Year of the Great Global Geopolitical Swing":
  • Global Systemic Crisis: 2012 : The Year of the Great Global Geopolitical Swing. 2012 will be a transition year year between the old world and the new world order.
  • USA 2012: Towards QE3 Tragedy. QE3 will play an important role in the transition.
  • Anticipations 2012 - 20 up and 15 down. 35 Key Trends for 2012. For example, LEAP anticipates that People will become more and more angry, revolt around the world  and contribute to the transition. They also expect that the power of central banks will decrease and that the Euro crisis will disappear in the headlines as the UK and the US debt crises will come back in front pages.
  • Strategic and operational recommendations
  • The GlobalEurometre - Results & Analyses 
The next month, LEAP/E2020 will unveil its anticipations for Europe 2012-2016 in GEAB 62.
The full GEAB 61 (PDF format) is available to subscribers for 200 Euros per year (10 + 6 issues).

Marc Faber Picks at 2012 Barron's Roundtable

The first month of the year is time for Barron's roudtable. There were 10 panelists for 2012:

  • Scoot Black - Delphi Management
  • Fred Hickey - The High Street Strategist
  • Abby Joseph Cohen - Global Markets Institutes
  • Brian Rogers - T. Rowe Price
  • Marc Faber - The Gloom, Doom & Boom Report
  • Meryl Witmer - Eagle Capital Partners
  • Mario Gabelli - Gamco Investors Inc.
  • Oscar Schafer - O.S.S. Capital Management
  • Bill Gross - Pimco
  • Felix Zulauf - Zulauf Asset Management
They discussed their views on the economy and markets and gave their picks for 2012.

Here are Marc Faber's Picks for 2012:

Investment/Ticker Price 1/6/12
Big-Cap Stocks
Total / TOT$50.75
Nestlé / NESN.Switzerland54.00 CHF
Novartis / NVS$57.31
Pfizer / PFE21.57
Singapore
SATS / SATS.SingaporeS$2.23
K-REIT Asia Management / KREIT.Singapore0.89
StarHub / STH.Singapore2.9
Wing Tai Holdings / WINGT.Singapore0.99
Fraser & Neave / FNN.Singapore6.35
Hong Kong
Sun Hung Kai Properties / 16.Hong KongHK$98.20
Swire Pacific / 19.Hong Kong75.45
Hang Seng Bank / 11.Hong Kong92.9
India
India Capital Fund*$66.24
Short
International Business Machines / IBM$182.54
Salesforce.com / CRM101.06
Australian dollar A$1=$1.02
*Price of A shares as of 9/30/2011.
Source: Bloomberg

Here's the part of Barron's Roundtable where he explains his long picks:

Faber: My preference is asset diversification, as we don't know how much money governments will print, the size of fiscal deficits and so forth. The biggest uncertainty is what will happen to the Chinese economy. The Chinese probably can continue to muddle through, easing interest rates again to keep things up. But we're dealing with an economy driven by capital spending, which is driven by credit, which wasn't the case until 2008.


Faber: There is a huge amount of underground lending throughout Asia. Mr. Bernanke can drop his dollar bills on the U.S., but the growth in dollars here can lead to strong economic growth and inflation in other countries. That has happened in the past few years. I am the most bearish person you can imagine on earth, which is why I recommend putting, say, 25% of your money in equities, 25% in precious metals, 25% in cash and bonds and 25% in real estate. These assets won't go up substantially this year, but they could preserve your wealth.

People say large-capitalization stocks are inexpensive, and I agree. I would buy a basket of high-quality big-caps in Europe and the U.S. You can by Total [TOT], in France, which yields more than 5%, and Nestlé [NESN.Switzerland] and Novartis [NVS] and 
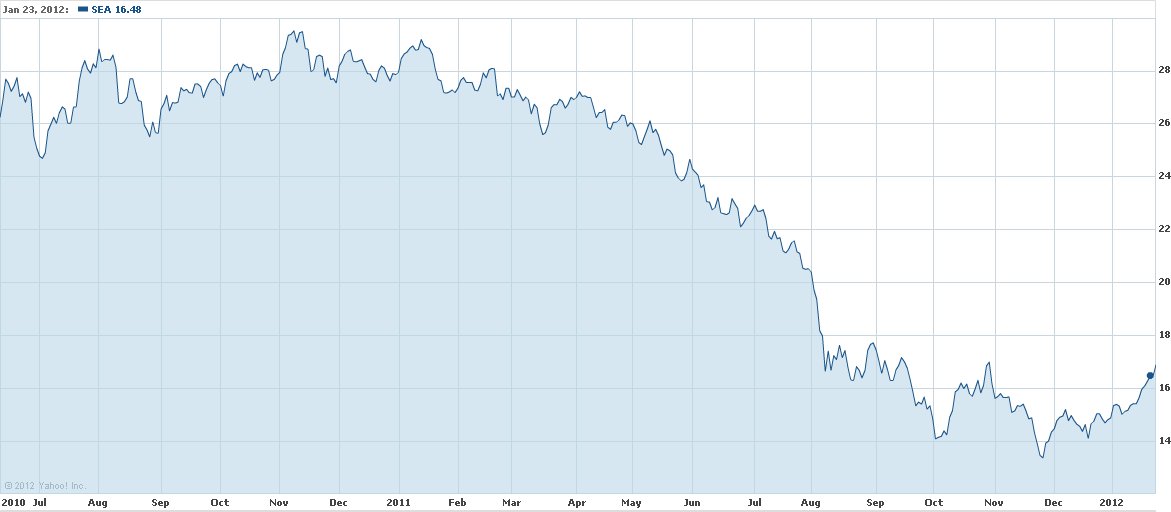
Pfizer [PFE]. These stocks don't have huge downside risk. Because emerging markets saw big declines last year, you could also buy SATS [SATS.Singapore], in Singapore, which provides catering services to the airline industry and ports. It yields 5% and trades for 13 times earnings. I also like K-REIT Asia Management [KREIT.Singapore], a real-estate investment trust that yields 7%. The stock has fallen by about 50% and the dividend might be cut. But even if it is cut to 4%, this is an OK investment. These stocks won't go up right away, but reinvesting dividends will yield an adequate return over time. StarHub [STH.Singapore], the mobile-phone company, yields 6.9% and the P/E is 14.

Zulauf: If China decelerates sharply, won't markets like Singapore have another big hit?

Faber: The question is, to what extent has that been discounted already? They could fall another 20%, but a luxury-property developer like Wing Tai Holdings [WINGT.Singapore] already sells for half its book value. I am positive about Singapore in the long run because more Europeans are moving there, and to Hong Kong. Because of banking-secrecy laws it is probably safer to have a bank account in Singapore than Europe.
The Hong Kong market was hit hard, and stocks haven't bottomed yet. But you can buy Sun Hung Kai Properties [16.Hong Kong], with a P/E of five and a yield of 3.5%. Swire Pacific [19.Hong Kong] is a blue-chip, a well-managed conglomerate. It yields almost 5% and the P/E is 11. Hang Seng Bank [11.HK] yields 5.6% and trades for 11 times earnings. There isn't a huge risk in these stocks, but maybe I'm too bullish.

and his short picks:

Faber: IBM [IBM] is a good short. It is the back office of the world. There is room for earnings disappointment. If China implodes, the Australian dollar will go downwhill. That's another short. A third is Salesforce.com [CRM], which I recommended shorting in the June Roundtable ["Buy Low, Stay Nimble," June 13, 2011].


Faber: Order, order. I haven't finished. Fraser & Neave [FNN.Singapore], in Singapore, is a conglomerate similar to Swire. It sells for 10 times earnings and yields about 3%. It could become a takeover target at some point. Lastly, I am the chairman of the India Capital Fund [an open-end fund sold outside the U.S.]. The fund and the Indian currency have been hit hard, and the fund could go lower. But the U.S. outperformed India last year on the order of 40%, and the Indian market looks attractive at 12 times earnings. As Chen Zhao at BCA Research said, in China the macro backdrop is fantastic and the micro is a disaster, but in India the macro is a disaster and the micro is fantastic. India has very good companies. The fund is overweight the banks and has a P/E of 10.
Last year I was overweight the U.S. relative to emerging economies. At what stage will the outperformance of the U.S. cease and emerging markets rise again? It could be three or six months, or a year. I am gradually increasing my exposure to emerging markets. Thai and Indian banks have no exposure to Europe. Indian banks lend domestically.

Why is the Indian economy having trouble?
 
Faber: Money-printing in the U.S. created food and energy inflation. In poor countries the percentage of per capita income spent on food and energy is much higher than in advanced societies.

Faber: Yes. Credit was growing rapidly and the hangover period could last for a while but these markets are good long-term investments. I travel extensively in these countries and you can see the growth of economic development. People go from bicycles to motorcycles, and from motorcycles to cars. First-time buyers of cars jump socially, as do first-time buyers of homes. Thailand has several consumer-credit companies. Buyers will do everything to pay off their loans. They aren't going to walk away. Plus, bankruptcy laws are tough.
Hedge funds performed badly last year, with few exceptions. Why is that? The bond market was strong, gold was up 11% and the U.S. market was flat, but sectors such as utilities did well. This year the economy could contract and stocks could go ballistic as central banks print money. If investors are diversified, they might do all right.

If you are interested in the full Barron's roundtable transcript and have the time to go thru the 9 pages, you can do so by reading the article Listen Up, Class: Here's How to Profit.


Saturday, January 14, 2012

Marc Faber on US and Europe Credit Ratings

Marc Faber interview on CNBC on Friday 13th 2012.

As France lost its AAA ratings, they discuss what could happen in the Europe, which countries could leave, which ones could stay and how it may affect the Euro. Marc Faber also said that he was not interested in buying any kind of government debt, be it French or American.

He expects the rest of the world (including Europe) to start outperforming the US markets sometimes in 2012, as the US market has better performed than most countries in 2011.

Finally, in case a further deterioration of the economy he expect massive money printing over the world and favor dividend paying high-quality companies such as Total and Novartis.

Friday, January 13, 2012

Jim Rogers: Short Emerging Markets, Long Base Metals

Jim Rogers is interviewed by ETNow (India) on the 13th of January 2012.

He explains he sees the markets faring relatively well in 2012 because there are 40 elections in the world this year and politicians will spend money to get reelected. However, we may have a serious crisis coming in 2013 or 2014. In 2012, he seems particularly bullish on base metals. He is still short on emergent markets such as Indian, Brazil and Indonesia because they went up too much, too fast.

When asked about Gold, he says he owns it, do not plan to sell, but do not plan to buy for now as Gold has been in a bull market for 12 years without yearly corrections.

Thursday, January 12, 2012

Eric Sprott: The Financial System is a Farce

Sprott Asset Management published their monthly newsletter Market at Glance (January 2012) entitled "The Financial System is a Farce: Part Three".

This month, the newsletter is shorter than usual with 3 pages. Eric Sprott and David Baker explain that 2011 was a year with more bailouts, more kicking the can down the road and more denial.

Eurozone is not fixable,  there’s too much debt and the politicians don’t know what’s going on. Nothing has structurally changed. There’s more global debt than there was a year ago, and it’s the same old song: extend
and pretend, extend and pretend,…

After October 2007 and September 2008, its' the 3rd time Sprott Management says the Financial System is a Farce (hence the title) and they re-affirmed their bearish views on the economy and markets.

In 2011, they found four farcical (but not funny) events:
  • MF Global bankruptcy with  US$1.2 billion of missing customer funds and the CME did not act as a backstop.
  • Dodd-Frank financial reform aka "Too Big to Fail" regulations signed in 2010 has barely been implemented in 2011 (e.g. CFTC positions limits)
  • Europe and the European Central Bank (ECB) with another bailout (LTRO) and the states who lend to banks with the banks lending back to states.
  • National Defense Authorization Act (NDAA), not directly a financial issue, but when you make investments 'Political risk’ should also apply  in the US (and other developed countries)  and not only in developing or third world countries.
The full version of the newsletters is available at http://www.sprott.com/Docs/MarketsataGlance/2012/January-2012.pdf